

Table of Contents
- What key small business metrics should you monitor?
- Build out your business story with these financial KPIs
- How to choose the right financial KPIs for your business story and overall business metrics
- Keep your KPIs sharp—and your funding options sharper.
If you want your business to grow, you need to know your numbers. Not just your revenue or your costs—but the key indicators that show where you’re strong, where you’re slipping, and where to focus next. That’s where monitoring your small business metrics comes into play.
| “Metrics and KPIs give you the full picture of how your business is performing—operationally, financially, and customer-wise,” Credibly Founder Ryan Rosett said. “Financial KPIs are how you spot problems early, double down on what’s working, and prove your business is ready for its next move.” |
In this blog post, we break down the KPIs and metrics that matter most—and how to use them to steer your business forward.
What key small business metrics should you monitor?
You don’t need to monitor every metric—just the ones that actually move the needle for your business.
Unlike enterprise-level companies that track global supply chains and multi-region logistics, small businesses should stay focused on financial key performance indicators (KPIs)—and beyond—that reflect how well you’re serving your customers, managing your team, and growing your bottom line.
The difference between metrics and KPIsNot all numbers carry the same weight. Metrics and KPIs both measure performance—but they serve different purposes. Metrics are general performance data. You can track just about anything: website visits, invoice processing time, inventory turnover, or average delivery speed. These numbers help you monitor activity and spot patterns. They give you a baseline and let you see how things change over time. KPIs, on the other hand, are the numbers that matter most to your business goals. They’re tied to outcomes—like hitting a revenue target, reducing churn, or boosting output. Every KPI is a metric, but not every metric is a KPI. What makes a KPI different is that you’re actively measuring it against a goal. It’s there to tell you whether you’re on track—or need to pivot. Think about it this way:
|
Here’s a breakdown of the core KPIs and metrics that help you understand where your business stands—and what to do next.
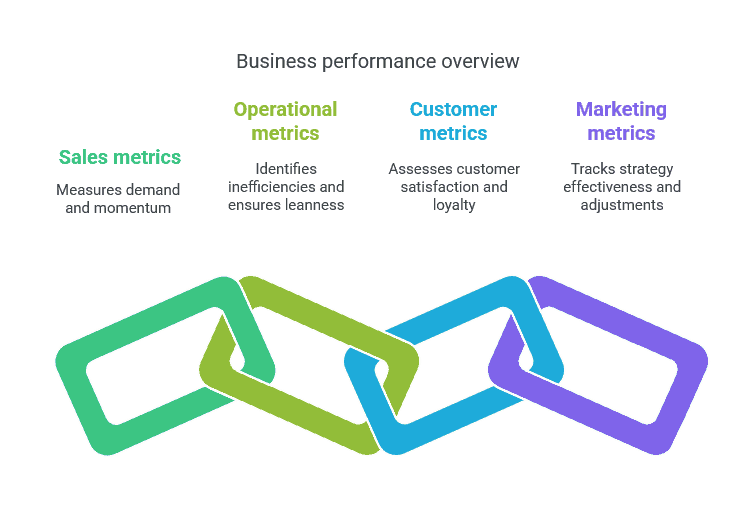
Sales metrics
These KPIs help you measure demand and track momentum.
- Revenue: The total amount of money your business brings in from sales.
- Net profit: What’s left after expenses—your actual earnings.
- Growth rate: Are you gaining traction month over month?
Operational metrics
Behind-the-scenes performance impacts everything else. These KPIs help you spot inefficiencies and stay lean.
- Payroll: Monitor labor costs to avoid surprises.
- Overtime (OT): Rising OT may signal understaffing or process issues.
- Use of assets: Keep tabs on how efficiently your drivers, vehicles, or equipment are used.
Customer metrics
Happy customers drive repeat business. These KPIs show how well you’re meeting expectations and building loyalty.
- Lifetime value: How much revenue a customer generates over time.
- Retention and churn rates How many customers stick around and how many leave.
- Satisfaction scores: Tools like NPS or CSAT give insight into how people feel after doing business with you.
- Delivery performance: On-time and accurate shipping rates keep your brand strong.
Marketing metrics
Track how your strategy is going and what you need to change about your outreach.
- Lead volume: The number of new prospects entering your funnel.
- Conversion rate: How many leads turn into paying customers?
Put together your business story with these financial KPIs
How to calculate critical sales metrics
1. Revenue
Your revenue shows how much money your business brings in before costs. Whether you’re selling products, services, or both, this is your starting line.
Revenue = Price per unit × Number of units sold
Tip: If you’re using accrual accounting, this includes sales made on credit. With cash accounting, it only includes payments you’ve actually received.
2. Net profit
This is what you keep after paying all your expenses—including rent, payroll, supplies, and taxes. It tells you if your business is profitable or bleeding cash.
Net profit = Revenue – Total expenses
Track this number monthly or quarterly. It’s your financial bottom line.
3. Sales growth
This critical financial KPI shows how fast your sales are increasing (or not). Use it to track the impact of marketing changes, seasonal shifts, or sales hires.
((Current period sales – Previous period sales) ÷ Previous period sales) × 100
Even small changes here can be meaningful. A dip might mean your strategy needs a tune-up.
How to calculate operational performance
How to calculate payroll
1. Figure out gross pay
This is your starting point. It’s the full amount an employee earns before anything is taken out.
- Hourly employees:
Hourly rate × hours worked
- Salaried employees:
Annual salary ÷ number of pay periods
Don’t forget to tack on extras like overtime, bonuses, or commissions—those count toward gross earnings too.
2. Factor in deductions
Now subtract what’s not staying in their paycheck.
- Pre-tax deductions: Things like health insurance or retirement contributions come out before taxes.
- Taxes: These include federal income tax, Social Security, Medicare, and any state or local taxes.
- Post-tax deductions: Anything else—like loan payments, union dues, or charitable giving—comes out after taxes.
3. Calculate net pay
This is what your employees actually take home.
Net pay = Gross pay – (Pre-tax deductions + taxes + post-tax deductions)
Turn financing into an asset.Tap into up to $600,000 in flexible financing—approved and funded in as little as 4 hours. |
How to calculate overtime
When your team clocks more than 40 hours, you need to account for the added cost. Here’s how to calculate overtime compensation:
- Start with the regular rate: This is what the employee earns per hour.
- Multiply by 1.5: This gives you the overtime rate—known as “time and a half.”
- Count overtime hours: Any hours worked beyond 40 in a week qualify.
- Calculate the extra pay: Overtime pay = Overtime rate × Overtime hours
- Add to base wages: Combine regular pay and overtime to get the total weekly compensation.
How to calculate use of assets
Your assets tell a powerful story—if you know how to read the numbers. These three ratios show how well you’re using what you have.
1. Return on Assets (ROA)
Shows how much profit you’re generating for every dollar of assets.
ROA = Net income ÷ Average total assets
2. Fixed asset turnover
This tells you how effectively your fixed assets—like machines or property—generate revenue.
Fixed asset turnover = Net sales ÷ Average net fixed assets
3. Debt to asset ratio
This ratio reveals what portion of your assets is funded through debt.
Debt to asset ratio = Total liabilities ÷ Total assets
| Discover how you can leverage financing for better business performance: |
How to calculate performance with customers
1. Customer Lifetime Value (LTV)
LTV tells you how much revenue you can expect from a typical customer over the course of your relationship. Knowing this number helps you decide how much to spend on acquiring new customers—or keeping the ones you already have.
LTV = Average purchase amount × Average purchases per year × Average customer lifespan (in years)
2. Retention and churn rates
Want to know if your customers are sticking around? These metrics will tell you.
- Churn rate: Tracks how many customers you lose over a period.
(Customers at start – Customers at end) ÷ Customers at start
- Retention rate: The flip side—what percentage of customers stayed.
100 – Churn rate (%)
If your churn rate is climbing, it’s time to rethink your post-sale strategy.
3. Satisfaction scores
To gauge how your customers feel, sometimes the best move is to just ask.
- CSAT (Customer Satisfaction Score): Ask customers to rate their experience from 1 to 5.
(Number of 4 and 5 ratings ÷ Total number of responses) × 100
- NPS (Net Promoter Score): Ask, “How likely are you to recommend us?” on a scale from 0–10. Subtract the % of detractors (0–6) from the % of promoters (9–10).
4. Delivery performance
- On-time delivery rate: Delivering late can cost you loyalty—and referrals.
(Total deliveries – Late deliveries) ÷ Total deliveries × 100
- Shipping accuracy: Getting it to the right place matters just as much as getting it there on time.
(Total deliveries – Incorrect deliveries) ÷ Total deliveries × 100
How to calculate marketing performance
1. Average monthly leads
Knowing how many leads come in every month helps you spot patterns—and take action if the pipeline starts to dry up.
Total leads over a set time period ÷ Number of months in that period
Choose a time period when demand is steady to get a clean average.
2. Lead conversion rate
This tells you how well your team turns interest into paying customers. It helps you forecast revenue and refine your sales process.
(Number of conversions ÷ Number of leads) × 100
Example: If you talk to 100 leads and 15 convert, your rate is 15%.
How to choose the right financial KPIs for your business story and overall business metrics
The KPIs you decide to track will depend on your goals:
- Want stronger profits? Watch your net margin, ROA, and cash flow.
- Chasing growth? Track your lead volume, sales growth rate, and conversion rate.
- Need more efficiency? Look at payroll, overtime, and asset use.
Pick 2–3 KPIs per goal. That’s it. Keep it lean. Keep it focused.
How to use KPI data to guide action
Metrics are just numbers—until you do something with them.
- Spot problems early. Sales slowing down? Check conversion rates and lead sources.
- Back your decisions. Thinking about hiring? Look at your cash flow and workload.
- Stay on course. Got a target? Your KPIs tell you if you’re getting closer—or need to adjust.
When your KPIs show it’s time to move—whether that’s scaling, hiring, or retooling—your financing should move just as fast.